Note
Click here to download the full example code or to run this example in your browser via Binder
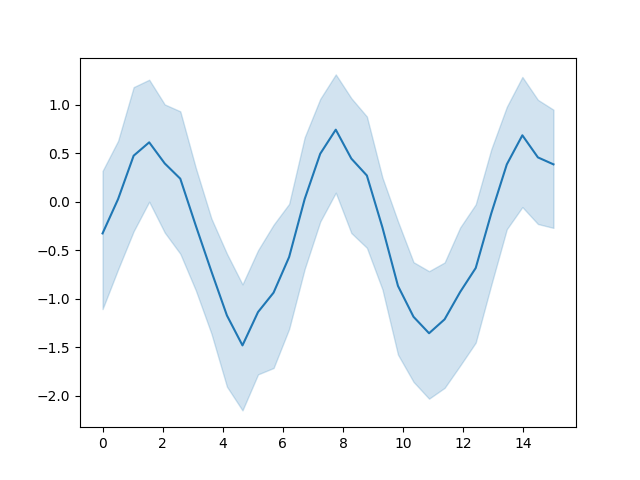
Seaborn example
This example demonstrates a Seaborn plot. Figures produced Matplotlib and by any package that is based on Matplotlib (e.g., Seaborn), will be captured by default. See Image scrapers for details.
Out:
/home/runner/work/mkdocs-gallery/mkdocs-gallery/examples/plot_02_seaborn.py:36: UserWarning:

FigureCanvasAgg is non-interactive, and thus cannot be shown
# Author: Michael Waskom & Lucy Liu
# License: BSD 3 clause

from __future__ import division, absolute_import, print_function


import numpy as np
import matplotlib.pyplot as plt
import seaborn as sns

# Enforce the use of default set style

# Create a noisy periodic dataset
y_array = np.array([])
x_array = np.array([])
rs = np.random.RandomState(8)
for _ in range(15):
    x = np.linspace(0, 30 / 2, 30)
    y = np.sin(x) + rs.normal(0, 1.5) + rs.normal(0, .3, 30)
    y_array = np.append(y_array, y)
    x_array = np.append(x_array, x)

# Plot the average over replicates with confidence interval
sns.lineplot(y=y_array, x=x_array)
# to avoid text output
plt.show()
Total running time of the script: ( 0 minutes 1.304 seconds)
![]()
Download Python source code: plot_02_seaborn.py