Note
Click here to download the full example code or to run this example in your browser via Binder
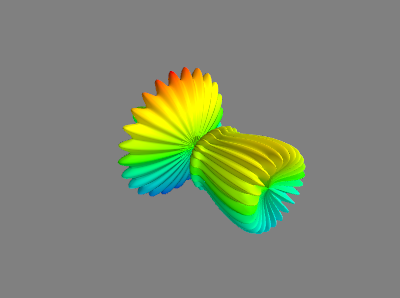
Example with the mayavi graphing library
Mkdocs-Gallery supports examples made with the mayavi library.
This mayavi demo is from the mayavi documentation.
# Create the data.
from numpy import pi, sin, cos, mgrid
dphi, dtheta = pi/250.0, pi/250.0
[phi,theta] = mgrid[0:pi+dphi*1.5:dphi,0:2*pi+dtheta*1.5:dtheta]
m0 = 4; m1 = 3; m2 = 2; m3 = 3; m4 = 6; m5 = 2; m6 = 6; m7 = 4;
r = sin(m0*phi)**m1 + cos(m2*phi)**m3 + sin(m4*theta)**m5 + cos(m6*theta)**m7
x = r*sin(phi)*cos(theta)
y = r*cos(phi)
z = r*sin(phi)*sin(theta)

# View it.
from mayavi import mlab
s = mlab.mesh(x, y, z)
Total running time of the script: ( 0 minutes 3.212 seconds)
![]()
Download Python source code: plot_10_mayavi.py