Note
Click here to download the full example code or to run this example in your browser via Binder
Choosing the thumbnail figure
This example demonstrates how to choose the figure that is displayed as the
thumbnail, if the example generates more than one figure. This is done by
specifying the keyword-value pair
mkdocs_gallery_thumbnail_number = <fig number> as a
comment somewhere below the docstring in the example file. In this example, we
specify that we wish for the second figure to be the thumbnail.
Out:
/home/runner/work/mkdocs-gallery/mkdocs-gallery/examples/plot_04_choose_thumbnail.py:38: UserWarning:

FigureCanvasAgg is non-interactive, and thus cannot be shown
# Code source: Óscar Nájera
# License: BSD 3 clause
import numpy as np
import matplotlib.pyplot as plt
def main():
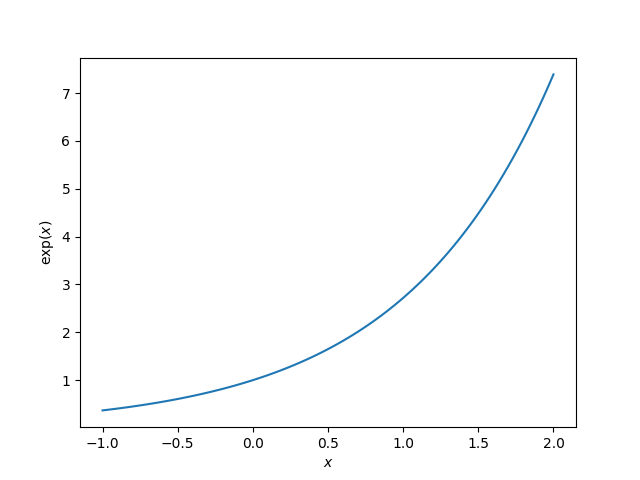
x = np.linspace(-1, 2, 100)
y = np.exp(x)
plt.figure()
plt.plot(x, y)
plt.xlabel('$x$')
plt.ylabel('$\exp(x)$')
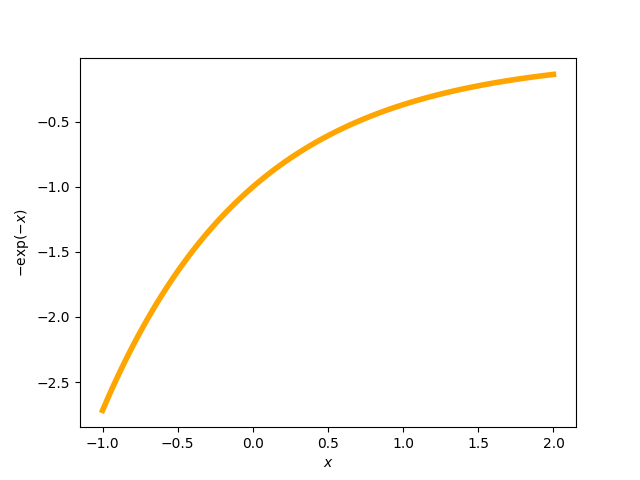
# The next line sets the thumbnail for the second figure in the gallery
# (plot with negative exponential in orange)
# mkdocs_gallery_thumbnail_number = 2
plt.figure()
plt.plot(x, -np.exp(-x), color='orange', linewidth=4)
plt.xlabel('$x$')
plt.ylabel('$-\exp(-x)$')
# To avoid matplotlib text output
plt.show()
if __name__ == '__main__':
main()
Total running time of the script: ( 0 minutes 0.374 seconds)
![]()
Download Python source code: plot_04_choose_thumbnail.py